Finding: Tesla’s Energy tab is not a trustworthy measurement surface under mixed regen and heat load.
- Signed rate showed −261.1 Wh/mi.
- Same window printed Consumed 2.6 kWh over the last 10 miles.
- Correct signed total is about −2.6 kWh (recovered), not consumed.
- Separately, hot Texas driving at 100°F+ makes optimistic range estimates a navigation hazard.
This is not a vibe post about “the UI feels weird.” It is a concrete analysis of one Energy-tab failure mode, why it matters for trip safety, and what a better Energy screen + range algorithm should do.
1. Evidence
Context A — mountain regen window: crossing Monarch Pass, elevation loss produced strong regeneration. Projected range ballooned to 999+ mi.
Context B — hot-road range trust: Texas driving in temps in excess of 100°F, where cabin cooling and battery thermal management dominate consumption and projected range drifts from actual remaining range enough to break navigation trust.
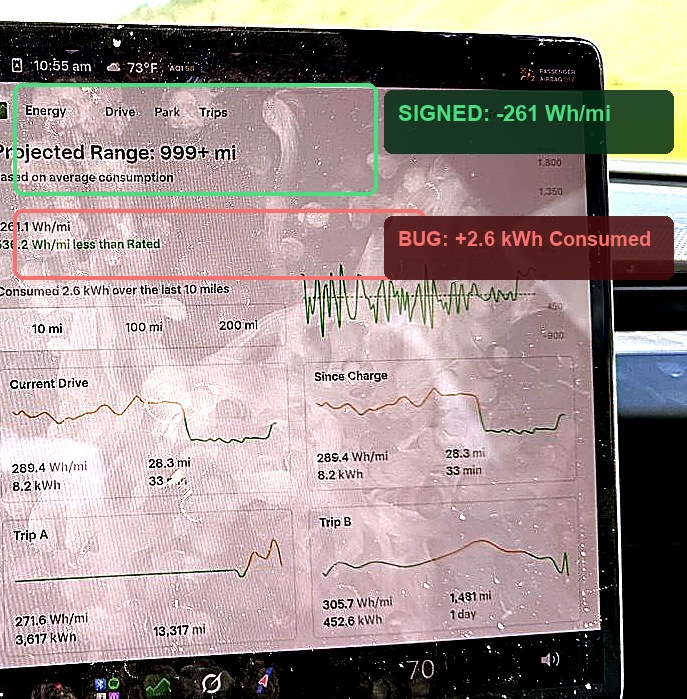
Displayed rate
−261.1 Wh/mi
536.2 Wh/mi less than Rated
Displayed 10-mi total
Consumed 2.6 kWh
Wrong sign + wrong verb
Correct 10-mi total
−2.6 kWh
Recovered / net energy in
Projected range
999+ mi
Not an actionable nav quantity
2. Defect analysis
| Check | Result | Why it matters |
|---|---|---|
| Unit consistency | Rate in Wh/mi, total in kWh | Fine if conversion is correct |
| Sign consistency | FAIL | Rate negative, total presented positive |
| Language consistency | FAIL | “Consumed” for a recovery window |
| Arithmetic check | −261.1 × 10 = −2611 Wh ≈ −2.6 kWh |
Magnitude matches; side of zero does not |
| Likely code smell | abs(integral) or non-negative template |
Classic display-layer footgun |
| Safety impact | Medium alone / High with nav coupling | Teaches drivers to distrust energy UX, then over-trust green range elsewhere |
Security / reliability frame: treat Energy UX as a safety surface, not cosmetics. Drivers use these numbers to decide whether a mountain descent is “free,” whether heat is killing range, and whether the next charger is reachable. A UI that flips signs is an integrity bug.
# What the UI appears to do
rate = mean_wh_per_mi_last_10   # correctly signed, e.g. -261.1
total_kwh = abs(rate * 10) / 1000
label = f"Consumed {total_kwh:.1f} kWh over the last 10 miles"

# What it should do
energy_kwh = (rate * 10) / 1000  # keep the sign
if energy_kwh >= 0:
    label = f"Used {energy_kwh:.1f} kWh over the last 10 miles"
else:
    label = f"Recovered {abs(energy_kwh):.1f} kWh over the last 10 miles"
# always also expose: Net {energy_kwh:+.1f} kWh
3. Why range estimates strand people
The sign bug is the easy defect. The harder one is range as a false fuel gauge.
In Texas heat above 100°F, real consumption is dominated by:
- cabin HVAC load
- battery thermal management
- speed / aero
- grade changes after the estimate was formed
When projected range is optimistic, navigation plans become fiction: the car “thinks” you can skip a charger, then the estimate collapses late. That is how people get stranded — not because physics is unknowable, but because the UI sells a single confident number instead of a condition-aware band.
Condition
100°F+
Texas heat, A/C + thermal load
What breaks
Nav trust
Projected range treated as fuel
Failure mode
Stranding
Optimistic plan, late collapse
Needed output
Range band
Conservative bound for routing
4. Recommended Energy screen layout
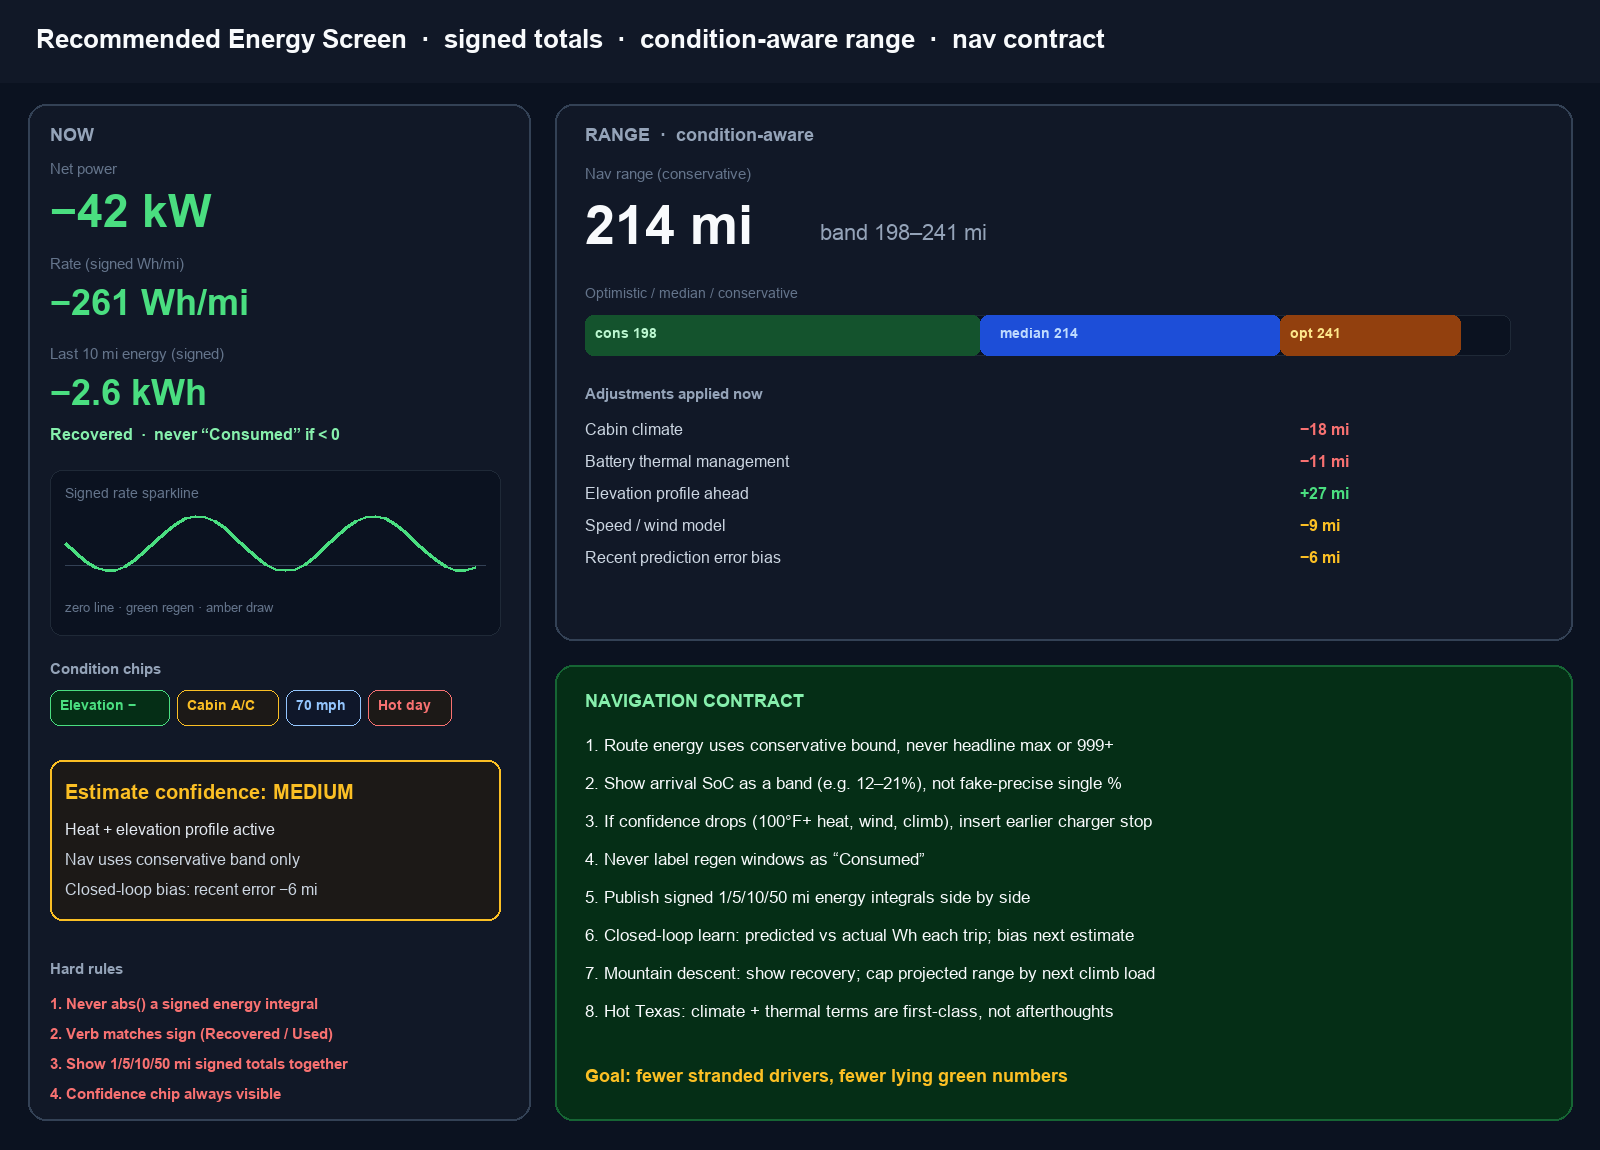
Layout rules:
- NOW column: net power (kW), signed Wh/mi, signed 1/5/10/50 mi energy totals.
- Verb grammar: Used / Recovered / Net — never “Consumed” for negative windows.
- Sparkline through zero: green below zero (regen), amber/red above (draw).
- Condition chips: elevation, cabin A/C, speed, hot day — always visible when active.
- Confidence chip: LOW / MED / HIGH. If not HIGH, nav must not use optimistic numbers.
- RANGE panel: primary number = conservative nav range; secondary = median/optimistic; always show band.
- Adjustment list: climate, thermal, grade, speed/wind, closed-loop bias — each with signed mile impact.
- No 999+ as actionable fuel: fantasy projections stay diagnostic, never route inputs.
5. Range algorithm improvements
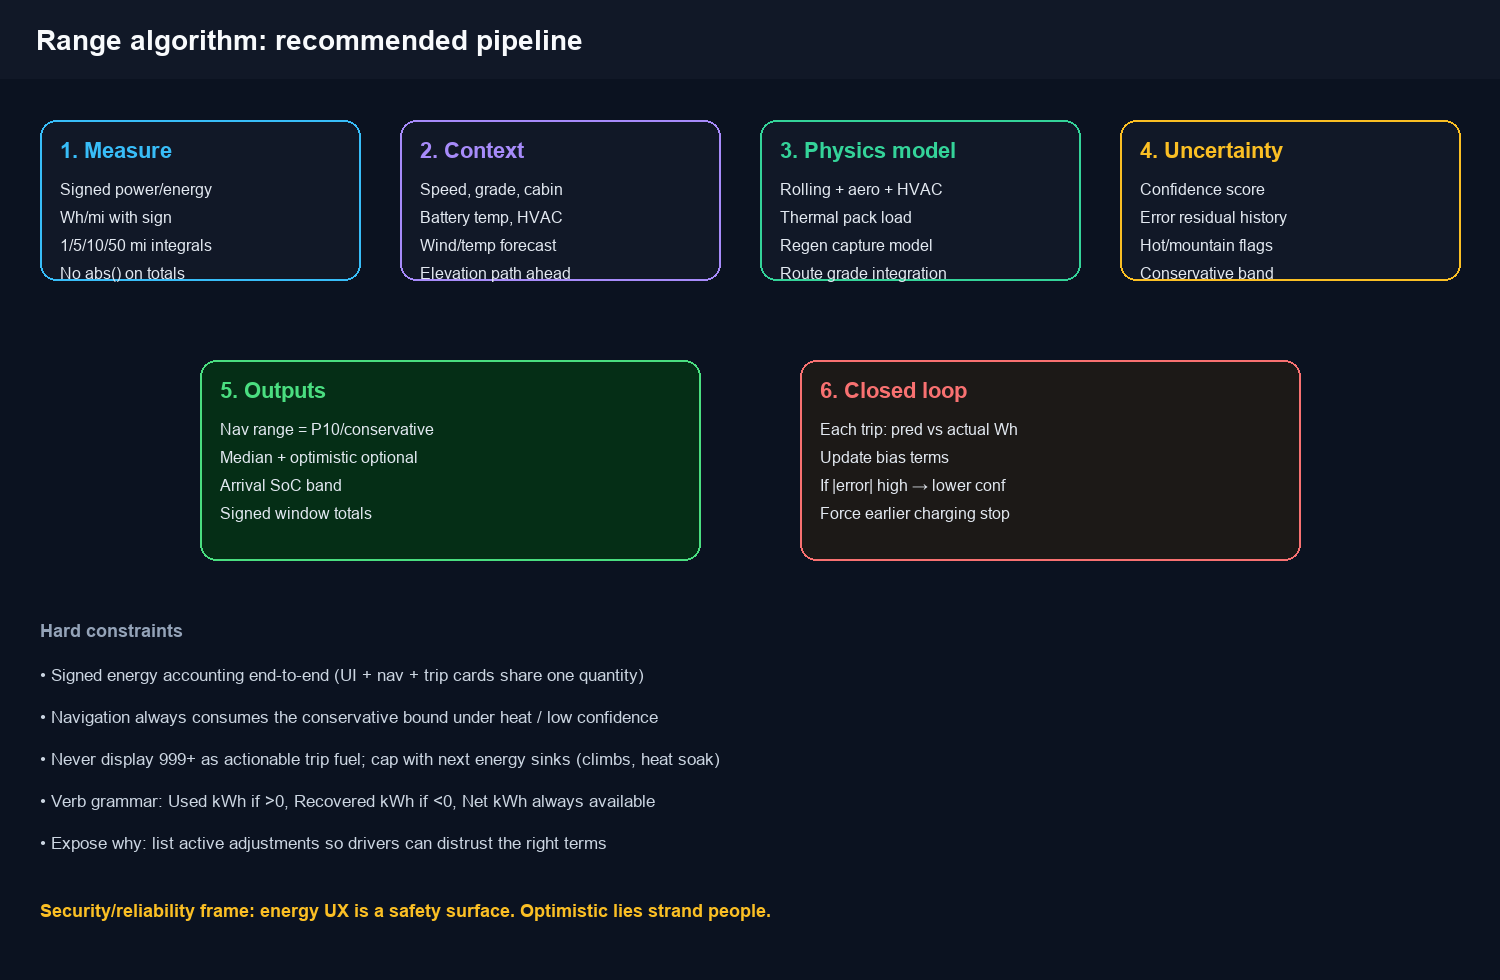
| Stage | Do this | Do not do this |
|---|---|---|
| Measure | Keep signed Wh integrals for 1/5/10/50 mi | abs() before display or logging |
| Context | Cabin setpoint, outside temp, pack temp, grade path, speed, wind | Flat “average consumption” only |
| Model | Split rolling / aero / HVAC / thermal / regen capture | One blended Wh/mi forever |
| Uncertainty | Produce P10 / P50 / P90 style band | Single fake-precise mile count |
| Navigation | Route on conservative bound when conf < HIGH or temp ≥ 100°F | Route on optimistic or 999+ |
| Closed loop | Each trip: predicted vs actual Wh; update bias | Forget error after arrival |
| Mountain logic | Credit descent recovery; reserve energy for next climb | Let descent alone print 999+ as trip truth |
| Heat logic | HVAC + thermal as first-class terms | Treat summer desert like a dyno cell |
Concrete algorithm contract for nav:
nav_range_mi = conservative_range(
    route_grade_profile,
    speed_plan,
    cabin_load,
    pack_thermal_state,
    ambient_temp,
    recent_prediction_bias,
)

if ambient_temp_f >= 100 or confidence < HIGH:
    route_using(nav_range_mi)          # P10 / conservative only
    show_arrival_soc_band = True
    allow_skip_charger = False
else:
    route_using(nav_range_mi)
    show_median_optional = True
6. Priority fix list (ship order)
- P0 — Sign integrity: stop absolute-valuing window energy; fix Used/Recovered labels.
- P0 — Shared quantity: Energy tab, trip cards, and nav planner must read the same signed energy model.
- P0 — Nav conservative mode: under heat or low confidence, route on the low bound only.
- P1 — Range band UI: replace single-point range with conservative/median/optimistic + confidence.
- P1 — Adjustment transparency: show mile impacts for climate, thermal, grade, speed.
- P1 — Closed-loop bias: learn predicted vs actual Wh every trip.
- P2 — Cap fantasy projections: 999+ can exist as a diagnostic artifact, never as a trip plan input.
- P2 — Arrival SoC band: “12–21% at charger” beats “17%” false precision.
7. Photo provenance
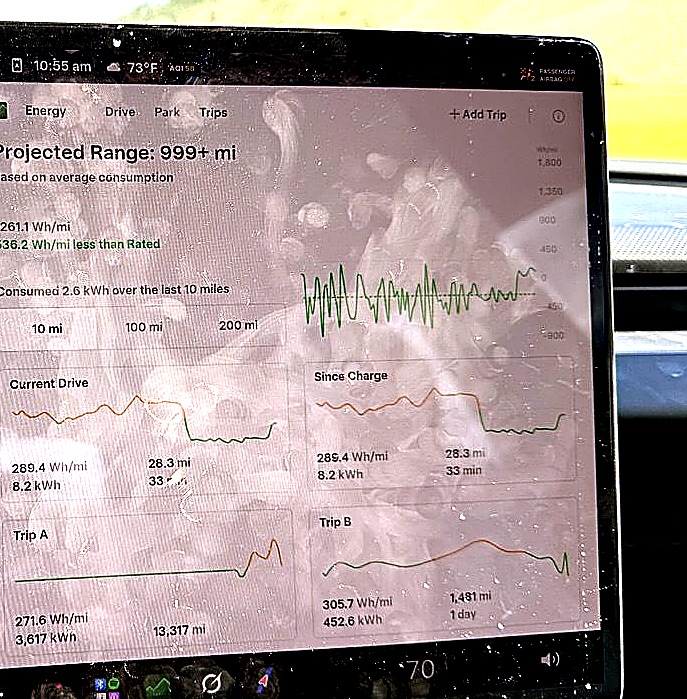
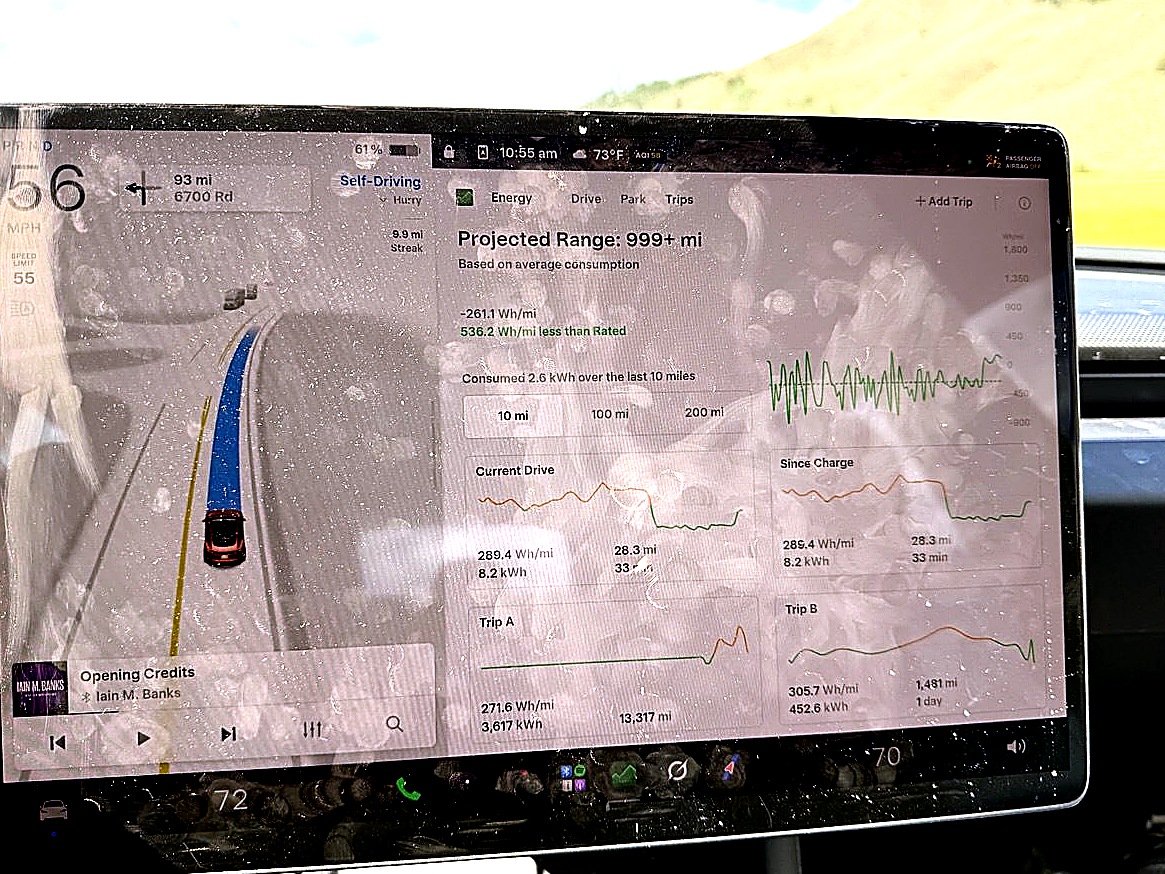
| Also on screen | Readout |
|---|---|
| Current Drive | 289.4 Wh/mi · 8.2 kWh · 28.3 mi · 33 min |
| Since Charge | 285.4 Wh/mi · 8.2 kWh · 28.3 mi · 33 min |
| Trip A | 271.6 Wh/mi · 3,617 kWh · 13,317 mi |
| Trip B | 305.7 Wh/mi · 452.6 kWh · 1,481 mi · 1 day |
Caveats: screenshot software version not captured. Monarch Pass explains the signed regen moment. Texas 100°F+ experience is the separate range-estimate / navigation-risk context. This is phone-photo evidence plus engineering analysis, not a CAN-bus lab capture.
Bottom line
−261.1 Wh/mi × 10 mi is −2.6 kWh, not “Consumed 2.6 kWh.”
Fix the sign. Fix the verb. Then stop letting optimistic range theater drive navigation in heat and mountains. Energy UX is a safety surface — design it like one.